NOAA in fact provides daily averages of several environmental parameters for thousands of weather stations scattered across the globe, completely free.
In details, NOAA provides the following data:
- Mean temperature for the day in degrees Fahrenheit to tenths
- Mean dew point for the day in degrees Fahrenheit to tenths
- Mean sea level pressure for the day in millibars to tenths
- Mean station pressure for the day in millibars to tenths
- Mean visibility for the day in miles to tenths
- Mean wind speed for the day in knots to tenths
- Maximum sustained wind speed reported for the day in knots to tenths
- Maximum wind gust reported for the day in knots to tenths
- Maximum temperature reported during the day in Fahrenheit to tenths
- Minimum temperature reported during the day in Fahrenheit to tenths
- Total precipitation (rain and/or melted snow) reported during the day in inches and hundredths
- Snow depth in inches to tenths
A description of the dataset can be found here: GSOD_DESC.txt
All these data are available from 1929 to 2014.
The problem with these data is that they require some processing before they can be used for any sort of computation.
For example, the stations ID and coordinates are available in a text file external to the data file, so each data file needs to be cross referenced to this text file to extract the coordinates of the weather station.
Moreover, the data files are supplied as either one single .tar file or as a series of .gz files, that if extract give a series of .op textual files, which can then be opened in R.
All these steps would require some sort of processing before they can be used in R. For example one could download the data file and extract them with 7zip.
In this blog post I would provide a way of downloading the NOAA data, cleaning them (meaning define outliers and extract the coordinates for each location), and then plot them to observe their location and spatial pattern.
The first thing we need to do is loading the necessary packages:
library(raster)

library(XML)

library(plotrix)
Then I can define my working directory:
setwd("C:/")
At this point I can download and read the coordinates file from this address: isd-history.txt
The only way of reading it is by using the function read.fwt, which is used to read "fixed width tables" in R.
Typical entries of this table are provided as examples below:
024160 99999                                                                NO DATA  NO DATA

024284 99999 MORA                          SW      +60.958 +014.511 +0193.2 20050116 20140330

024530 99999 GAVLE/SANDVIKEN AIR FORCE BAS SW      +60.717 +017.167 +0016.0 20050101 20140403
Here the columns are named as follow:
- USAF = Air Force station ID. May contain a letter in the first position
- WBAN = NCDC WBAN number
- CTRY = FIPS country ID
- ST = State for US stations
- LAT = Latitude in thousandths of decimal degrees
- LON = Longitude in thousandths of decimal degrees
- ELEV = Elevation in meters
- BEGIN = Beginning Period Of Record (YYYYMMDD)
- END = Ending Period Of Record (YYYYMMDD)
As you can see, the length of each line is identical but its content varies substantially from one line to the other. Therefore there is no way of reading this file with the read.table function.
However, in read.fwt we can define the length of each column in the dataset so that we can create a data.frame out of it.
I used the following widths:
- 6 - USAF
- 1 - White space
- 5 - WBAN
- 1 - White space
- 38 - CTRY and ST
- 7 - LAT
- 1 - White space
- 7 - LON
- 9 - White space, plus Elevation, plus another White space
- 8 - BEGIN
- 1 - White space
- 8 - END
After this step I created a data.frame with just USAF, WBAN, LAT and LON.
The two lines of code for achieving all this are presented below:
coords.fwt <- read.fwf("ftp://ftp.ncdc.noaa.gov/pub/data/gsod/isd-history.txt",widths=c(6,1,5,1,38,7,1,8,9,8,1,8),sep=";",skip=21,fill=T)<br />
coords <- data.frame(ID=paste(as.factor(coords.fwt[,1])),WBAN=paste(as.factor(coords.fwt[,3])),Lat=as.numeric(paste(coords.fwt$V6)),Lon=as.numeric(paste(coords.fwt$V8)))
As you can see, I can work directly using the data link, there is actually no need to have this file local.
After this step I can download the data files for a particular year and extract them. I can use the function download.file from XML to download the .tar file, then the function untar to extract its contents.
The code for doing so is the following:
#Download Measurements
year = 2013
download.file(paste("ftp://ftp.ncdc.noaa.gov/pub/data/gsod/",year,"/gsod_",year,".tar",sep=""),destfile=paste(getwd(),"/Data/","gsod_2013.tar",sep=""),method="auto",mode="wb")

#Extract Measurements
dir.create(paste(getwd(),"/Data/Files",sep=""))
untar(paste(getwd(),"/Data/","gsod_2013.tar",sep=""),exdir=paste(getwd(),"/Data/Files",sep=""))
I created a variable year so that I can change the year I want to investigate and the script will work in the same way.
I also included a call to dir.create to create a new folder to store the 12'511 data files included in the .tar file.
At this point I created a loop to iterate through the file names.
#Create Data Frame
files <- list.files(paste(getwd(),"/Data/Files/",sep=""))

classes <- c(rep("factor",3),rep("numeric",14),rep("factor",3),rep("numeric",2))

t0 <- Sys.time()
station <- data.frame(Lat=numeric(),Lon=numeric(),TempC=numeric())
for(i in 1:length(files)){

data <- read.table(gzfile(paste(getwd(),"/Data/Files/",files[i],sep=""),open="rt"),sep="",header=F,skip=1,colClasses=classes)
if(paste(unique(data$V1))!=paste("999999")){
coords.sub <- coords[paste(coords$ID)==paste(unique(data$V1)),]

 if(nrow(data)>(365/2)){
  ST1 <- data.frame(TempC=(data$V4-32)/1.8,Tcount=data$V5)
  ST2 <- ST1[ST1$Tcount>12,]
  ST3 <- data.frame(Lat=coords.sub$Lat,Lon=coords.sub$Lon,TempC=round(mean(ST2$TempC,na.rm=T),2))
  station[i,] <- ST3
 }
} else {
coords.sub <- coords[paste(coords$WBAN)==paste(unique(data$V2)),]

 if(nrow(data)>(365/2)&coords.sub$Lat!=0&!is.na(coords.sub$Lat)){
  ST1 <- data.frame(TempC=(data$V4-32)/1.8,Tcount=data$V5)
  ST2 <- ST1[ST1$Tcount>12,]
  ST3 <- data.frame(Lat=coords.sub$Lat,Lon=coords.sub$Lon,TempC=round(mean(ST2$TempC,na.rm=T),2))
  station[i,] <- ST3
 }

}
print(i)
flush.console()
}
t1 <- Sys.time()
t1-t0
I also included a time indication so that I could check the total time required for executing the loop, which is around 8 minutes.
Now let's look at the loop a bit more in details. I start it by opening the data file from the file.list named files using the function read.table coupled with the function gzip. This function can read the content of the .gz file as text so that it can be read as a table.
Then I set up an if statement because in some cases the station can be identified by the USAF value, in other cases USAF is equal to 999999 and therefore it needs to be identified by its WBAN value.
Inside this statement I put another if statement to exclude values without coordinates or with less than 6 months of data.
Then I also included another quality check, because after each measurements NOAA provides also the number of observation used to calculate each daily average. So I used this information to exclude the daily averages computed from less than 12 hours.
In this case I was only interested in Temperature data, so all my data.frames extracted only that property from the data files (and converted it to Celsius). However, it would be fairly easy to focus on different environmental data.
The loop fills the empty data.frame named station I create just before starting the loop.
At this point I can exclude the NAs from the data.frame, use the package sp to assign coordinates and plot them on top of country polygons:
Temperature.data <- na.omit(station)
coordinates(Temperature.data)=~Lon+Lat

dir.create(paste(getwd(),"/Data/Polygons",sep=""))
download.file("http://thematicmapping.org/downloads/TM_WORLD_BORDERS_SIMPL-0.3.zip",destfile=paste(getwd(),"/Data/Polygons/","TM_WORLD_BORDERS_SIMPL-0.3.zip",sep=""))
unzip(paste(getwd(),"/Data/Polygons/","TM_WORLD_BORDERS_SIMPL-0.3.zip",sep=""),exdir=paste(getwd(),"/Data/Polygons",sep=""))
polygons <- shapefile(paste(getwd(),"/Data/Polygons/","TM_WORLD_BORDERS_SIMPL-0.3.shp",sep=""))

plot(polygons)
points(Temperature.data,pch="+",cex=0.5,col=color.scale(Temperature.data$TempC,color.spec="hsv"))
The results is the plot is presented below:

The nice thing about this script is that I just need to chance the variable called year at the beginning of the script to change the year of the investigation.
For example, let's say we want to look at how many stations meet the criteria I set here in 1940. I can just change the year to 1940, run the script and wait for the results. In this case the waiting is not long, because at that time there were only few stations in USA, see below:

However, if we skip forward 10 years to 1950, the pictures changes.
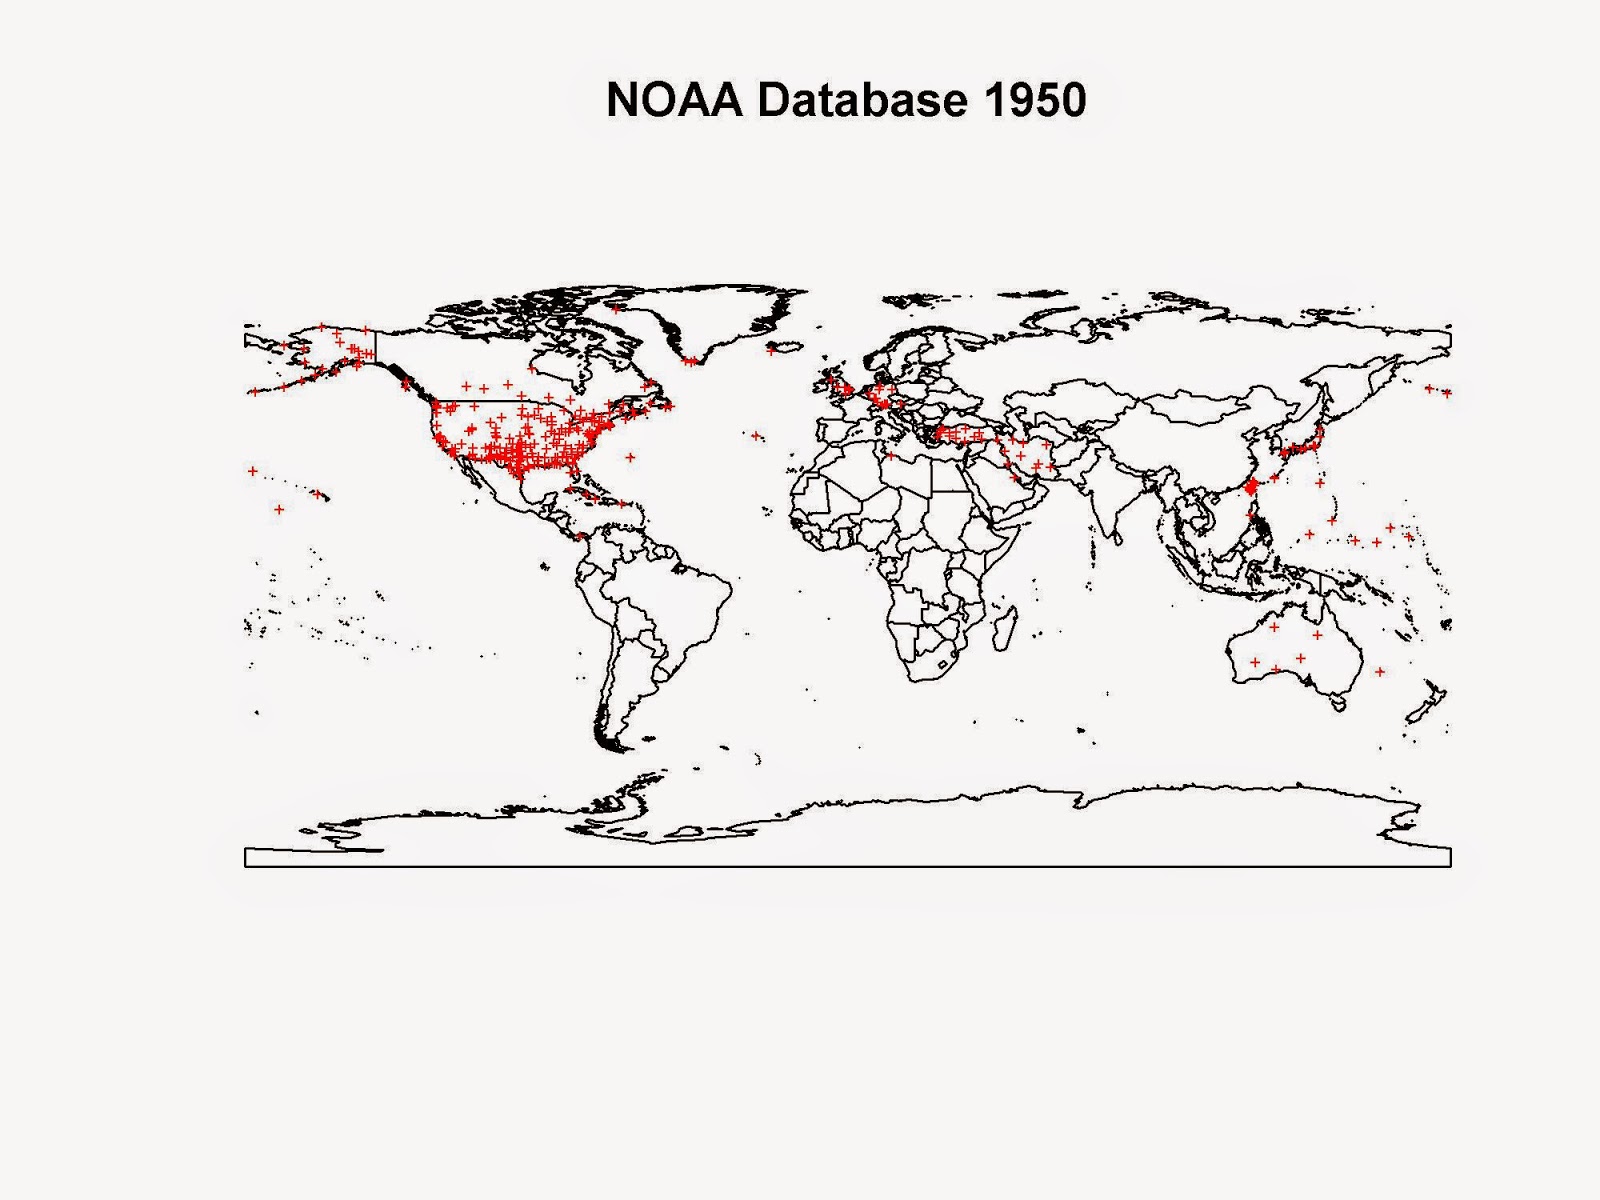
The second world war was just over and now we have weather stations all across countries that were highly involved in it. We have several stations in UK, Germany, Australia, Japan, Turkey, Palestine, Iran and Iraq.
A similar pattern can be seen if we take a look at the dataset available in 1960:

Here the striking addition are the numerous stations in Vietnam and surroundings. It is probably easy to understand the reason.
Sometimes we forget that our work can be used for good, but it can also be very useful in bad times!!
Here is the complete code to reproduce this experiment:
library(raster)
library(gstat)
library(XML)
library(plotrix)


setwd("D:/Wind Speed Co-Kriging - IPA Project")

#Extract Coordinates for each Station
coords.fwt <- read.fwf("ftp://ftp.ncdc.noaa.gov/pub/data/gsod/isd-history.txt",widths=c(6,1,5,1,38,7,1,8,9,8,1,8),sep=";",skip=21,fill=T)
coords <- data.frame(ID=paste(as.factor(coords.fwt[,1])),WBAN=paste(as.factor(coords.fwt[,3])),Lat=as.numeric(paste(coords.fwt$V6)),Lon=as.numeric(paste(coords.fwt$V8)))


#Download Measurements
year = 2013
dir.create(paste(getwd(),"/Data",sep=""))
download.file(paste("ftp://ftp.ncdc.noaa.gov/pub/data/gsod/",year,"/gsod_",year,".tar",sep=""),destfile=paste(getwd(),"/Data/","gsod_",year,".tar",sep=""),method="auto",mode="wb")
#Extract Measurements
dir.create(paste(getwd(),"/Data/Files",sep=""))
untar(paste(getwd(),"/Data/","gsod_",year,".tar",sep=""),exdir=paste(getwd(),"/Data/Files",sep=""))


#Create Data Frame
files <- list.files(paste(getwd(),"/Data/Files/",sep=""))

classes <- c(rep("factor",3),rep("numeric",14),rep("factor",3),rep("numeric",2))

t0 <- Sys.time()
station <- data.frame(Lat=numeric(),Lon=numeric(),TempC=numeric())
for(i in 1:length(files)){

data <- read.table(gzfile(paste(getwd(),"/Data/Files/",files[i],sep=""),open="rt"),sep="",header=F,skip=1,colClasses=classes)
if(paste(unique(data$V1))!=paste("999999")){
coords.sub <- coords[paste(coords$ID)==paste(unique(data$V1)),]

 if(nrow(data)>(365/2)){
  ST1 <- data.frame(TempC=(data$V4-32)/1.8,Tcount=data$V5)
  ST2 <- ST1[ST1$Tcount>12,]
  ST3 <- data.frame(Lat=coords.sub$Lat,Lon=coords.sub$Lon,TempC=round(mean(ST2$TempC,na.rm=T),2))
  station[i,] <- ST3
 }
} else {
coords.sub <- coords[paste(coords$WBAN)==paste(unique(data$V2)),]

 if(nrow(data)>(365/2)&coords.sub$Lat!=0&!is.na(coords.sub$Lat)){
  ST1 <- data.frame(TempC=(data$V4-32)/1.8,Tcount=data$V5)
  ST2 <- ST1[ST1$Tcount>12,]
  ST3 <- data.frame(Lat=coords.sub$Lat,Lon=coords.sub$Lon,TempC=round(mean(ST2$TempC,na.rm=T),2))
  station[i,] <- ST3
 }

}
print(i)
flush.console()
}
t1 <- Sys.time()
t1-t0

Temperature.data <- na.omit(station)
coordinates(Temperature.data)=~Lon+Lat

dir.create(paste(getwd(),"/Data/Polygons",sep=""))
download.file("http://thematicmapping.org/downloads/TM_WORLD_BORDERS_SIMPL-0.3.zip",destfile=paste(getwd(),"/Data/Polygons/","TM_WORLD_BORDERS_SIMPL-0.3.zip",sep=""))
unzip(paste(getwd(),"/Data/Polygons/","TM_WORLD_BORDERS_SIMPL-0.3.zip",sep=""),exdir=paste(getwd(),"/Data/Polygons",sep=""))
polygons <- shapefile(paste(getwd(),"/Data/Polygons/","TM_WORLD_BORDERS_SIMPL-0.3.shp",sep=""))


jpeg(paste(getwd(),"/Data/",year,".jpg",sep=""),2000,1500,res=300)
plot(polygons,main=paste("NOAA Database ",year,sep=""))
points(Temperature.data,pch="+",cex=0.5,col=color.scale(Temperature.data$TempC,color.spec="hsv"))
dev.off()